Plotting a Volcano
This post is a test of the capabilities of the Blogdown R package and the Hugo Academia Theme. I thought that I would play with a bit of R code while I have the opportunity. Last year I could see this volcano from my window of my house so it was my Maunga then. I feel that it still is, spiritually. Among other things, it kept me fit running up to the tihi. Here is a small snippet from my Pepeha (2):
Kei Maunga Whau ahau e noho ana
The plot below uses geospatial data, included in the R base package. I think this neatly shows the New Zealand roots of the R software package. I feel a real sense of place thinking about the well-trodden path from the mountain to the University of Auckland, city campus.
The code below comes from: Fifty ways to draw a volcano using package plot3D by Karline Soetaert
# Preamble
library(plot3D)
# Reduce the resolution
 Volcano <- volcano[seq(1, nrow(volcano), by = 3),
                     seq(1, ncol(volcano), by = 3)]
image2D(Volcano, lighting = TRUE, rasterImage = TRUE,
contour = list(col = "white", labcex = 0.8, lwd = 3, alpha = 0.5))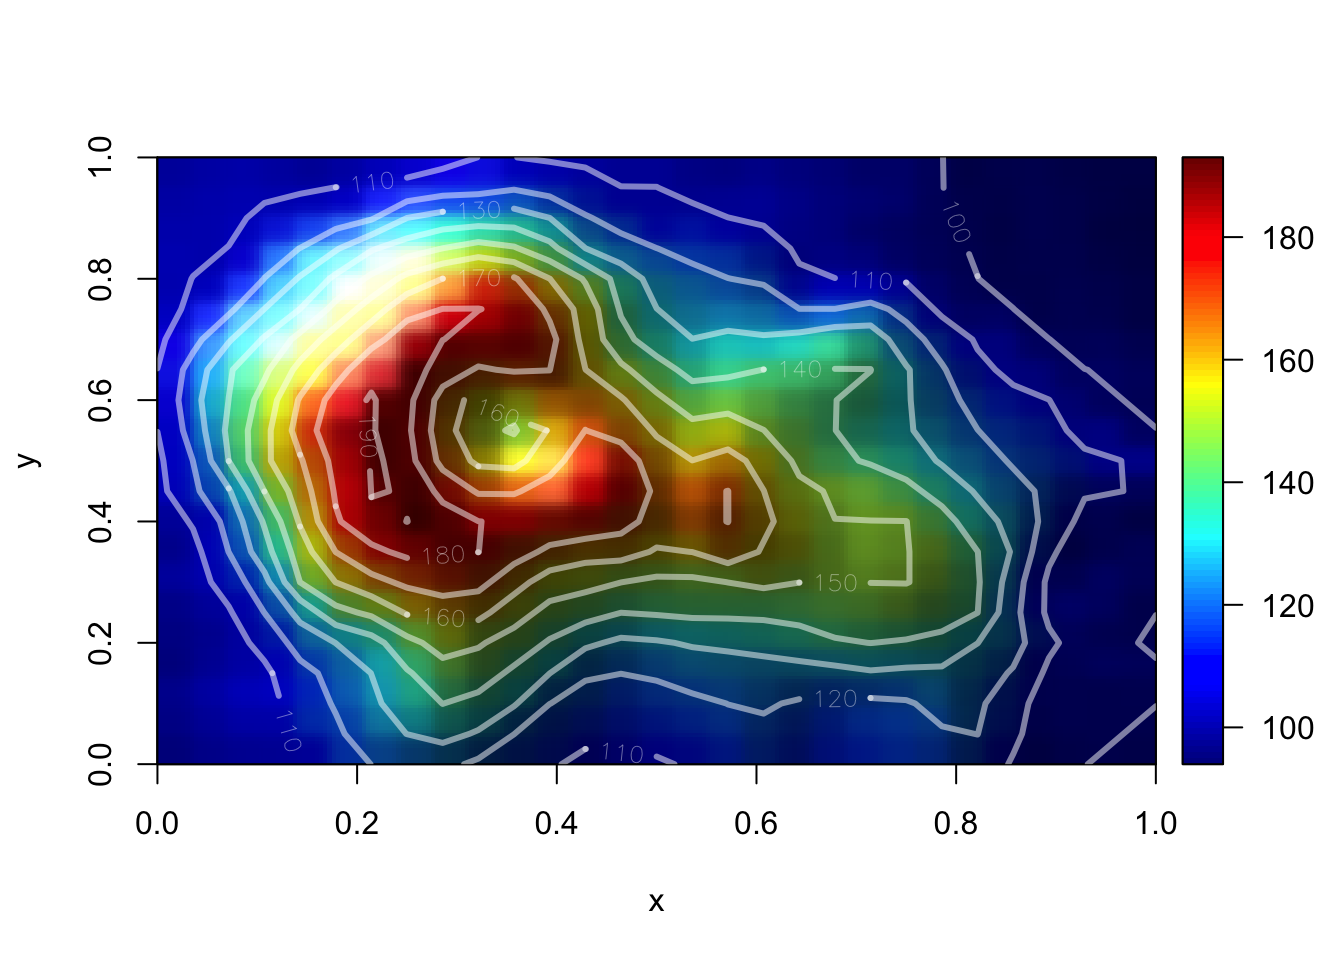
Unfortunately my chance to map and describe Maunga Whau has been put on hold by COVID. Maunga Whau is a much loved Auckland landmark and I know I’m not the only one fascinated by the Maunga of Te Ika-a-Māui, Aotearoa.
Hywel Stoakes
(he/him/his) | Lecturer, Phonetics and Phonology
Hywel Stoakes explores the sounds of speech in languages spoken today.